


RACE SCORE - HOW IT WORKS
The Race Score measures the quality of your performance within a single race, rather than comparing finish times directly. The UTMB Index is then built by combining multiple Race Scores across races and categories.
AN OBJECTIVE AND CONSISTENT CALCULATION METHOD
Convert your performance into a race score
This method ensures scores are objective, comparable across races, and independent of external conditions on the day. Whether the race was run in ideal or challenging weather, a strong performance earns the score it deserves — because all runners are measured against the same field on the same day. The result is a fair, consistent, and meaningful race for every finisher.
Building your UTMB Index
Your Race Score contributes to your UTMB Index. Race after race, it builds a consistent global reference of your performance over time.

4 steps to calculating Race Scores
Each race result undergoes the follwing four steps to calculate the Race Score. For each race, the system follows these exact steps:
1 - FINDING SIMILAR RACES
Which past races in the database can give us useful insights into this specific race? We scan the entire database and select only races that meet two simple criteria:
Time: The race must have taken place within the last 50 months (about 4 years and 2 months).
Effort: We convert distance + elevation into a single “effort” value. The race must have at least 65 % of the effort of the current race. There is no upper limit — longer or harder races are still included.
These selected races become the foundation for the rest of the analysis.
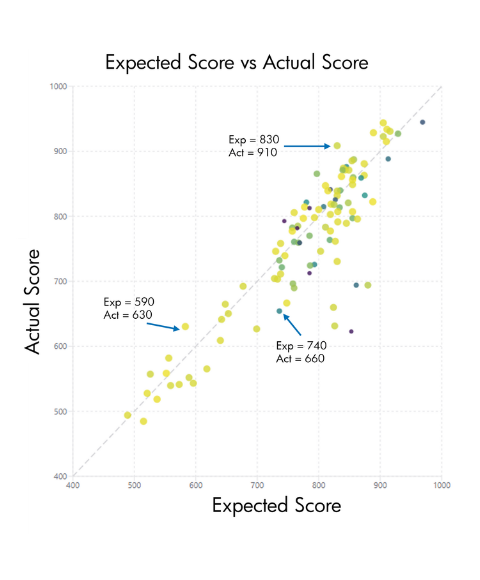
2 - CALCULATING THE EXPECTED SCORE FOR EACH RUNNER
We predict how each runner should perform in this race based on their relevant past results.
In simple terms: “Based on their best recent performances in similar conditions, what score would we realistically (but optimistically) expect this runner to achieve today?”
How we estimate this expected score
For each runner we:
- Use only past results that are timely and effort-relevant (from Step 1)
- Apply a weighting based on race similarity (distance + elevation) and recency
- Select up to the 5 best-weighted performances
- Ignore any race where the runner performed dramatically worse than their usual level
From these results we calculate one expected score per runner.
Confidence score
Because expected scores can vary in reliability, we also calculate a confidence score based on:
- Experience : number of relevant past results
- Relevance : similarity of those races
- Variability : consistency of performances
- Recency : how recent the races were
Important: These expected scores and confidence values are used only for this race calculation and are not connected to a runner’s overall UTMB Index.
3 - SELECTING RUNNER
We want the most reliable data possible to represent the whole field.
We now have an expected score and confidence value for many runners, but we don’t use them all. Instead we create a refined group by:
- Removing the slowest outliers (any runner who took more than twice as long as the winner).
- Keeping the runners with the highest confidence scores.
- Making sure the group still includes a mix of runner types: mostly top-ranked athletes, plus a small number of amateur runners.
The guiding principle is simple: a smaller amount of high-quality data is more useful than a large amount of low-quality data. At the end of this step we have a clean, balanced set of runners, each with an expected score and a confidence score.
4 - REGRESSION (CREATING THE RACE-SPECIFIC MODEL)
Turning the data into a score
We now turn the selected runners’ actual performances into a custom scoring formula for this exact race. For each runner in our refined group we have three pieces of information:
- Their actual race speed (in km/h)
- Their expected score (from Step 2)
- Their confidence (from Step 2)
These are shown on a graph :
Horizontal axis = race speed (km/h)
Vertical axis = expected score
Colour of each point = confidence (darker = lower confidence, brighter yellow = higher confidence)
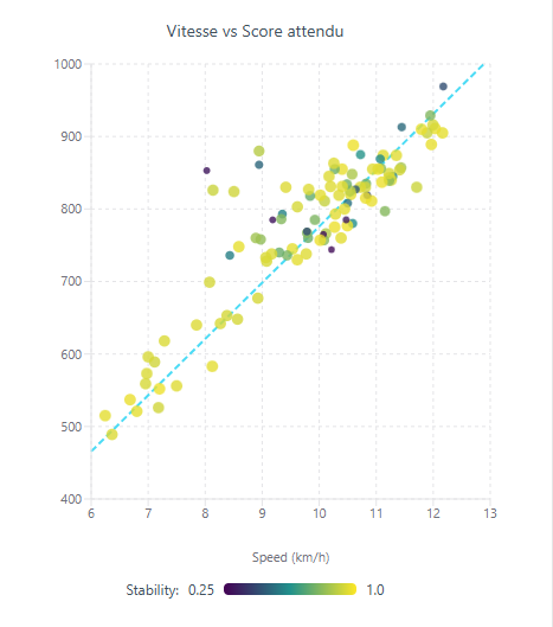
We then perform an asymmetric weighted regression. In plain English, this means we fit a straight line through the points, but with two important improvements that make the model both fair and accurate:
Confidence weighting : Runners with higher confidence pull the line more strongly toward them. This lets us use more data while still prioritising the most reliable runners.
Race-specific adjustments : The line is also gently adjusted using three objective race characteristics: average steepness of the terrain, average altitude, and overall competition level.
From regression to score
The result is a simple mathematical formula unique to this race:
Final Score = Coefficient × Race Speed (km/h)
This coefficient is different for every race because every race has different terrain and conditions.
Example conversion table (from a real race):
| Speed (km/h) | Score |
|---|---|
| 12.2 | 950 |
| 11.6 | 900 |
| 10.3 | 800 |
| 9.7 | 750 |
| 9.0 | 700 |
| 7.7 | 600 |
| 6.4 | 500 |
You can visualise this on the graph :
Draw a horizontal line at any expected score (e.g. 900), see where it crosses the regression line, and that speed becomes the speed that earns exactly 900 points in this race.

